Hill climbing the data UI with a council of three models
Three models from three providers scored our data UI next to Snowflake and Databricks, an agent fixed what they agreed on, and the next round scored again. Over nine rounds the score went from 6.1 to 7.5: past Databricks for two judges, still behind Snowflake for all three.
Our data UI worked, but next to Snowflake and Databricks it looked messy. We have no designer on the team. Over two days we turned “make it look better” into something a set of agents could climb: three models from three providers score screenshots of our UI next to the competitors, an agent fixes what they agree on, and the next round scores again. Over nine scored rounds the overall score went from 6.1 to 7.5, past Databricks for two of the three judges and still behind Snowflake for all three. The screenshots below show what changed.
The method is the one Theo Browne (t3.gg) describes in Agents Sucked At UI (Until Today). Have a “council” of strong models from different providers score the UI, fix what they flag, and repeat until they agree it is good enough. The part from 15:10 onwards is what made it work for us: do not score your app on its own, score it next to the products you want to beat. Theo found that Codex scored T3 Code’s main branch at 7 next to Claude Code and Codex, while the same model, looking at the app alone, had just given it a 9. A model looking at one design “with its brain wiped of all the other designs” will think it is fine.
The set-up
- Judges. Claude Opus 5.5, Grok 4.7 and Codex (GPT 6.1). Each one ran as a separate delegate in T3 Code with the same brief and wrote its result to its own file. None of them could see the others’ scores or change any file.
- What they scored. Six screens of ours, rendered from Storybook at 1280×800: the side navigation, the workspace home, the workspaces list, a catalog table, the SQL editor and a job run. Next to them, five real screenshots of Snowflake and Databricks. From round 4 on, every screen of ours was scored in both dark and light mode.
- The scale. Seven categories (typography, hierarchy, spacing and density, colour and contrast, iconography, consistency and polish, clarity) plus an overall score, 1 to 10. 10 means best-in-class enterprise SaaS.
- What they returned. Scores, the reasons for each score with the screenshot named, and a ranked “top 10 fixes” list with file and line references to our code.
- Constraints the judges could not argue with. The body text stays 12px: this is a dense data tool, by an earlier owner decision. Claude asked for 13px in round 0 and we said no. Everything follows the Schuberg Philis brand book: the palette through tokens, sentence case, yellow only as a marker, and no colour as the only signal. WCAG AA, Dutch as well as English.
- The loop. A summary file collects what all three agree on. An implementing agent (Claude) builds those fixes in a worktree and takes new screenshots. Then the next round scores again.
The rounds
| Round | What changed | Claude | Grok | Codex | Average | Snowflake | Databricks |
|---|---|---|---|---|---|---|---|
| 0 | Baseline (see “Capture from the commit you score”) | 5.8 | 6.3 | 6.2 | 6.1 | 7.9 | 7.77 |
| 1 | CSS fixes from the consensus list | 6.1 | 6.4 | – | 6.25 | 7.95 | 7.2 |
| 2 | More CSS: a surface ladder, title step | 6.6 | 6.2 | – | 6.4 | 8.0 | 7.85 |
| 3 | Last CSS round | 6.4 | 6.4 | – | 6.4 | 7.85 | 7.45 |
| 4 | Tier A: the design guide, tokens, one selection style, quiet graph nodes, dark and light | 7.1 | 6.7 | 7.3 | 7.03 | 8.03 | 7.7 |
| 5 | Every page built from shared lib/ui components with stories, and a guard spec | 7.2 | 7.1 | 7.3 | 7.2 | 8.03 | 7.83 |
| 6 | Tier A and the components merged to main (#439 to #442) | – | – | – | – | – | – |
| 7 | Tier B, first build: page templates, the SQL workbench, a run selector, grouped tabs, a workspace switcher | 6.8 | 6.5 | 7.2 | 6.83 | 8.07 | 7.7 |
| 8 | Ideas round: the finding line, the home as a brief, profiled results, the run strip | 6.8 | 6.6 | 7.1 | 6.83 | 8.1 | 7.6 |
| 9 | Repair only: the SQL editor and the job run, then polish | 7.3 | 7.3 | 7.9 | 7.5 | 8.13 | 7.63 |
Codex hit its usage limit in rounds 1 to 3, so those rounds have two judges. Round 6 was not scored: it is the merge to main, and its screenshots served as the “after” images of the first version of this post. Each average is the mean of the judges that scored that round, for the competitors too.
The scores per judge
Each chart shows one judge’s overall score for ours (solid) and for the two competitors (dashed) per round. The grey bands are rounds that judge did not score.
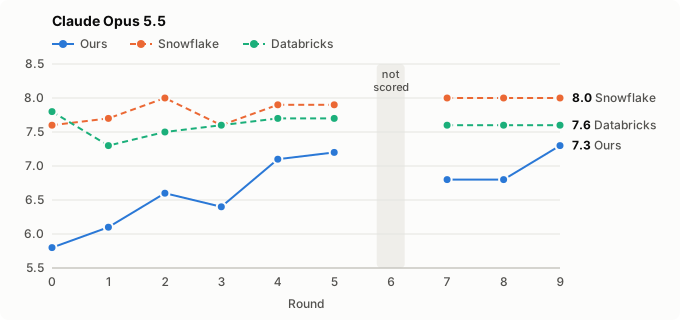
Claude was the strictest judge of ours at the start (5.8) and moved most: +1.5 by round 9. It never let us past either competitor; the gap to Databricks closed from 2.0 to 0.3.
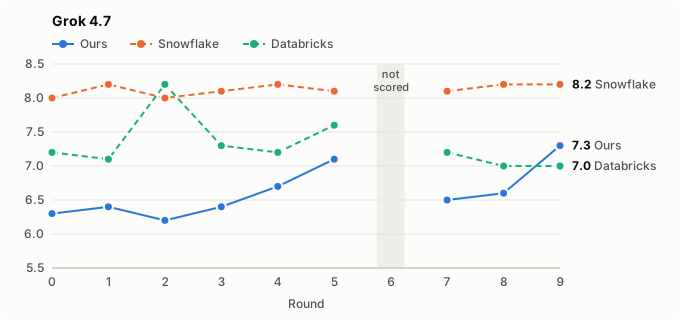
Grok put ours above Databricks for the first time in round 9 (7.3 against 7.0). Its Databricks score is also the most erratic line here: 8.2 in round 2, 7.0 in rounds 8 and 9, for the same three screenshots.
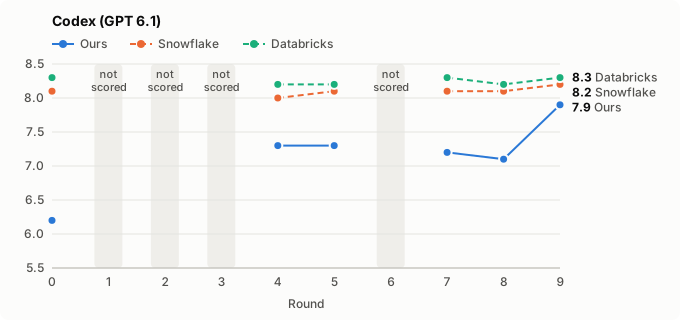
Codex scored all three products highest and missed rounds 1 to 3. Its round-9 score of 7.9 is the highest any judge gave ours, 0.3 behind Snowflake and 0.4 behind Databricks, which Codex rates above Snowflake throughout.
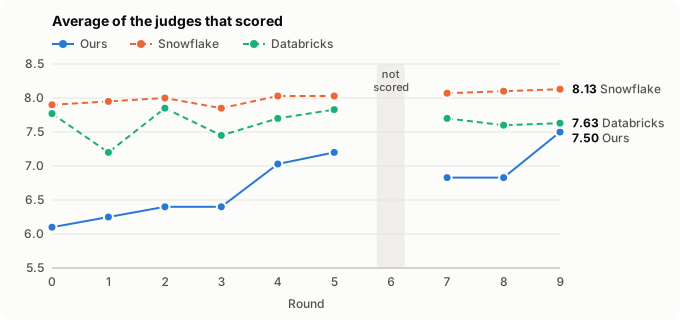
Averaged, ours climbed 1.4 points while Snowflake stayed within 7.85 to 8.13 and Databricks within 7.2 to 7.85. The two flat stretches, rounds 1 to 3 and rounds 7 to 8, are the two lessons below: small CSS fixes stall, and a round that regresses one screen loses what it gains on the others.
The journey after round 6
The first version of this post stopped at round 6, with tier A and the components on main. The owner then asked for two more rounds and a score above 9. It took three, and we did not get to 9.
Round 7: tier B, and the score fell. Tier B (OpenSpec change data-ui-layout, #441) was the layout work the judges had asked for: page templates with a type ramp (11, 12, 14, 18 and 24px, body still 12), the SQL editor as a workbench with a result dock, a run selector and node drawer on the job run, grouped tabs on the catalog object, and a workspace switcher. The structure got better and all three judges said so. The score went down 0.37 anyway, because four screens had new faults that all three judges named:
- the workspaces row joined the namespace to the counts line and clipped its pills;
- the SQL result became a navy slab with a 60 to 120px header;
- the home lost its purpose line, and the attention strip had the same fill as the rows;
- the job run clipped its attempts inside the graph’s box.
Round 8, first half: ask for ideas, not scores. Instead of another fix list, we asked each judge a different question: what would make a data engineer say this is better than both, and what would it take to get past 9? Each wrote an ideas document with bold moves, ranked by expected lift, and one “signature” element. The three signatures came out close to each other:
- Claude: the insight line. The brand book’s header is eyebrow, title, marker, subhead, and its writing rule is that a title states a finding. Make that sentence under the marker a fact with a baseline: “Succeeded in 6 min 31 s, 19 s over its 30-day median; report needed a second attempt.”
- Grok: the finding line. The same place, one sentence computed from the data the page already loads, with its action as a link. “The marker stays the brand mark. The sentence is the product mark.”
- Codex: the evidence seam. One blue selection rule that ties the selected row, column or task to a pane that answers “What happened?”, “What supports this?” and “What next?”. Less a sentence than a way of working.
Two of three proposed the same sentence under the marker without seeing each other’s work, and Codex’s seam asks the same question of the selection. That made it the one move every page got. The other moves the build took from the ideas: the workspace home as a brief (what needs attention, recent runs, your recent queries), a result that profiles its own columns, a run strip that sets this run against its last runs and their median, a three-group evidence band on the catalog table, and a workspaces list that compares quality across workspaces. Claude’s own arithmetic said these moves together would land at about 8.9 to 9.1.
Round 8, second half: flat. The ideas landed and the score stayed at 6.83. The judges called the home brief, the workspaces table and the catalog evidence band real gains; Claude called the finding line “our strongest asset”, one that neither competitor has. But two screens regressed, and they cost what the rest gained:
- the SQL editor clipped its tab, showed profiles that did not sit over their columns, lost its syntax colouring and made Run look disabled;
- the job run shrank its graph nodes to about 9px text, lost the command and retry lines, and hid the zoom.
Round 9: repair, nothing new. The build brief for round 9 had one rule: fix what round 8 broke and add no new moves. The SQL editor and the job run were rebuilt against the round-8 notes, and every screen was checked by eye in both themes before it was scored. That gave +0.67, the largest step of the whole exercise and more than tier A. All three judges wrote that nothing regressed. The work is in PR #445, open for review.
What we learned
Small CSS fixes stall. Rounds 1 to 3 each fixed the top of the consensus list, and the score went up by only 0.3 in total. We had set a stopping rule (stop when a round gains less than 0.3), and round 2 triggered it. The judges kept naming the same causes: boxes inside boxes, no real page title, too many filled elements per view, and one “Open” tile per feature. Those are missing parts of a system, not CSS bugs.
Ask what it would take. After round 3 we asked the judges a different question. Not “score this”, but “what would it take to reach 9.5?” They both said 9.5 was not realistic under our brand and the 12px rule, and that about 8.5 was. They also split the work into three tiers:
- A, presentation only. This became a written design guide (
docs/data-design-guide.md). - B, layout changes that alter what the spec promises. This became the OpenSpec change data-ui-layout.
- C, new product features such as recents and favourites. This became data-recents.
The owner set the target at 8.5. Tier A alone gave the largest jump up to then: +0.6.
Build the system, then score it. Round 5 moved every page onto shared, reusable components in lib/ui. Each
component has its own Storybook stories in dark and light. A guard spec (ui/pages.spec.ts) keeps a page’s own CSS
to layout only, with a per-page budget that can only go down. The score barely moved (+0.2). What the judges
noticed was consistency: “consistency and polish” went from 6.9 to 7.4. This step is the base for tier B, which is
where the remaining layout gains are.
Judges catch regressions. Round 5 named three things we had made worse:
- the job-run title had lost its heading font;
- “New catalog” had become a bare plus icon;
- the home tiles and graph nodes had gained hairline borders, which the brand book does not allow.
All three judges flagged them, and each came with a file reference. That is the main value of a council over one reviewer: when three models from three vendors name the same thing, it is almost always real.
A regression costs more than a move gains. Rounds 7 and 8 both added things the judges liked and both scored lower or flat, because one or two screens broke. The judges’ expected lifts were per move, from a repaired baseline; they did not survive a round that also broke a screen. Round 9, which only repaired, gained more than any round that added. Since then the build brief asks the implementing agent to look at every render in both themes before the round is scored, not only to run the Storybook tests.
Ideas from three vendors converge. The three ideas documents were written blind to each other. Two arrived at the same signature (a computed sentence under the brand marker) and the third at the same question in another form. Where they converge is where to build; where only one judge asks (Grok wants the finding line at 14px, the other two are fine at 12px), we leave it.
Capture from the commit you score. Writing this post, we found that four of the six round-0 screenshots were not rendered from main on the day. We had copied them from older Storybook review runs, from 16 October and 4 November. The job-run screenshot showed a card grid without edges, and the job graph had replaced that grid before we started. So the round-0 judges asked us to “draw dependency edges”, and those edges already existed. The round-0 scores are a little low for that reason. Since round 1, every screenshot has been rendered from the code being scored.
Light mode needs its own eyes. Rounds 0 to 3 scored dark only. When light mode joined in round 4, the judges found problems that dark mode had hidden: a washed-out second surface on the home page, a caret line that was too loud, and a quiet selection colour. Every Storybook story now has to pass in both themes.
The scores are vibes, and the scorers drift. The Snowflake and Databricks screenshots never changed, but their scores moved between rounds: Databricks ran from 7.0 to 8.3 depending on the judge and the round. Theo saw the same thing. We read the scores as a trend across three judges, never as a single number. Theo has a second warning that we only half followed at first: the round-5 brief asked the judges what was “left to reach 8.5”, so they knew the target. From round 7 on, the scoring brief no longer names a target.
Before and after
All six screens, in both themes. The before images are main on 6 November (commit d8766ccc), the day we started,
rendered afterwards from that commit. The after images are the round-9 build in PR #445, which is open for review
and not yet on main. All are Storybook renders at 1280×800 with fixture data. The numbered dots on the after images
are ours; the key under each screen says what changed there.
Side navigation
Before, the navigation was one flat list. After:
- a workspace switcher at the top, so the navigation is scoped to the workspace you are in;
- the items in groups (work, manage, admin), the group named in small mono text;
- one selection style everywhere: a filled row with a blue rail on the left, icons one size (16px);
- a collapse control at the foot.
| Before | After | |
|---|---|---|
| Dark |  |  |
| Light | 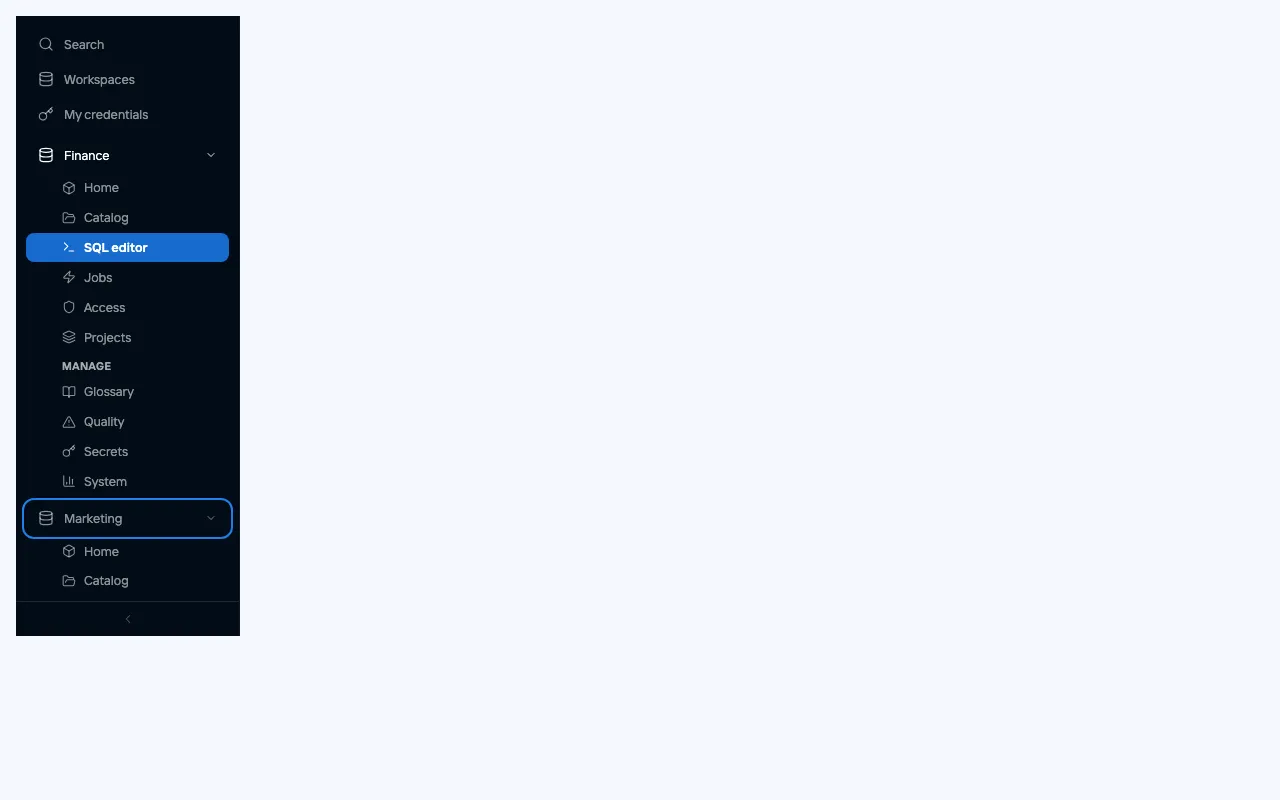 | 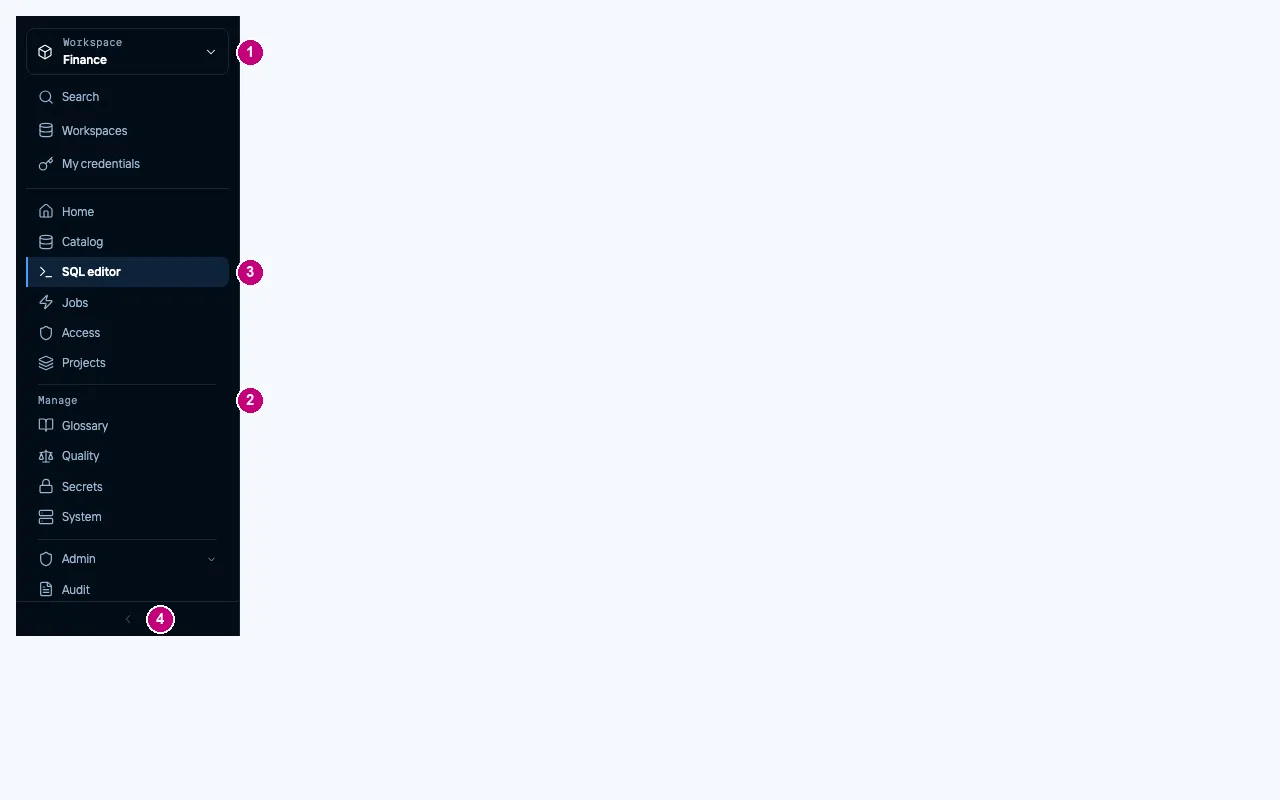 |
Workspace home
Before: six equal “Open” tiles in a bordered panel, and the breadcrumb said “Data · Workspaces” on every page. After, the home is a brief:
- the finding line under the title: what fails, what it reaches, how last night’s runs went, and a link to the failing checks;
- “Needs attention”: each failing table with the check that fails, its value against its limit, and what it affects downstream;
- the last five check outcomes as squares, each with its icon, and the words “3 of 5 passed”;
- recent runs, with their status in words and an icon;
- your own recent queries, with rows and duration;
- the actions beside the title, one of them filled.
| Before | After | |
|---|---|---|
| Dark | 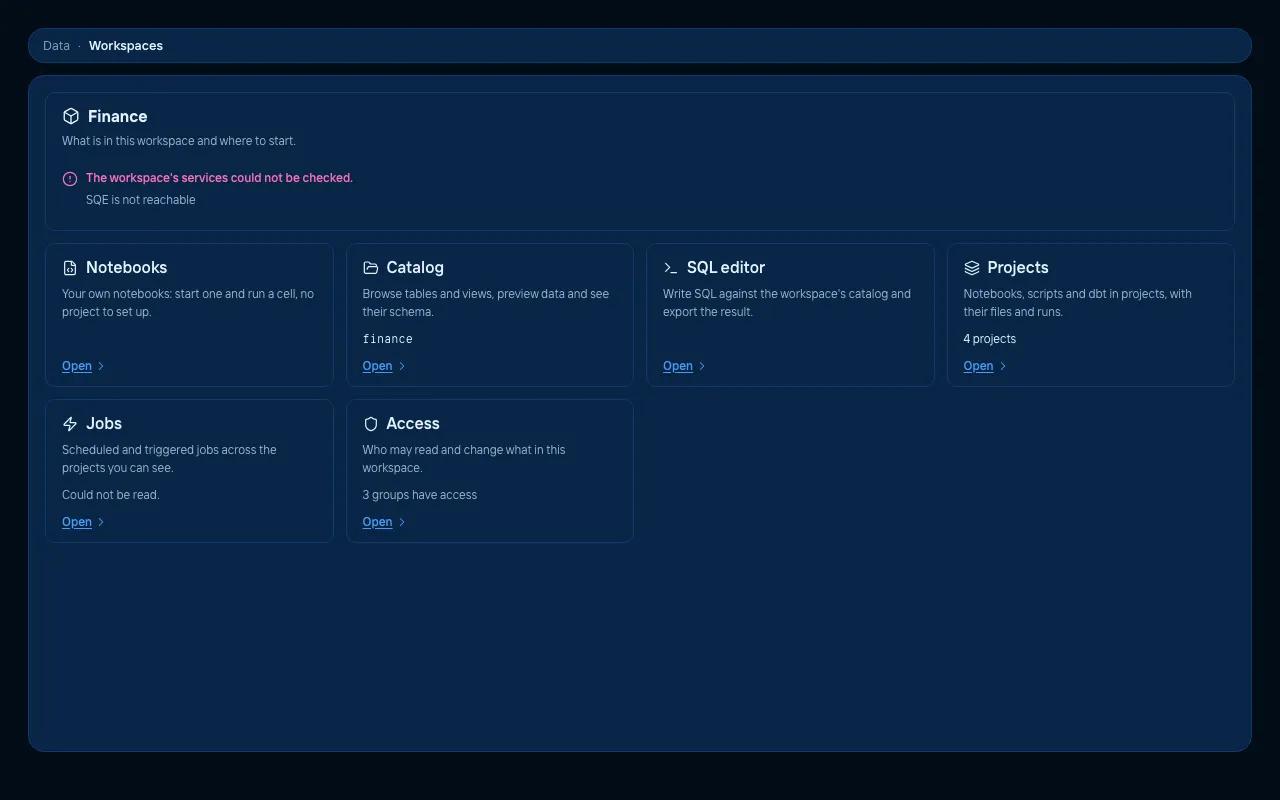 | 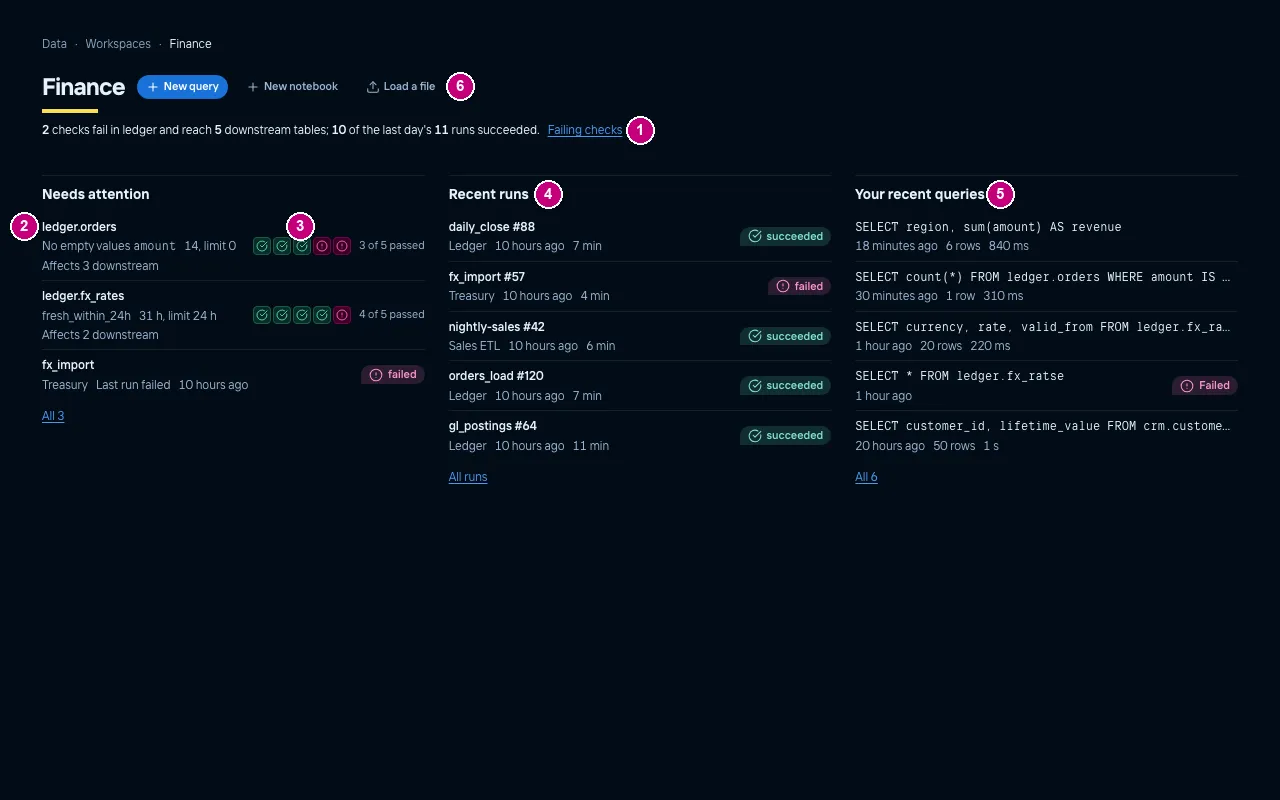 |
| Light | 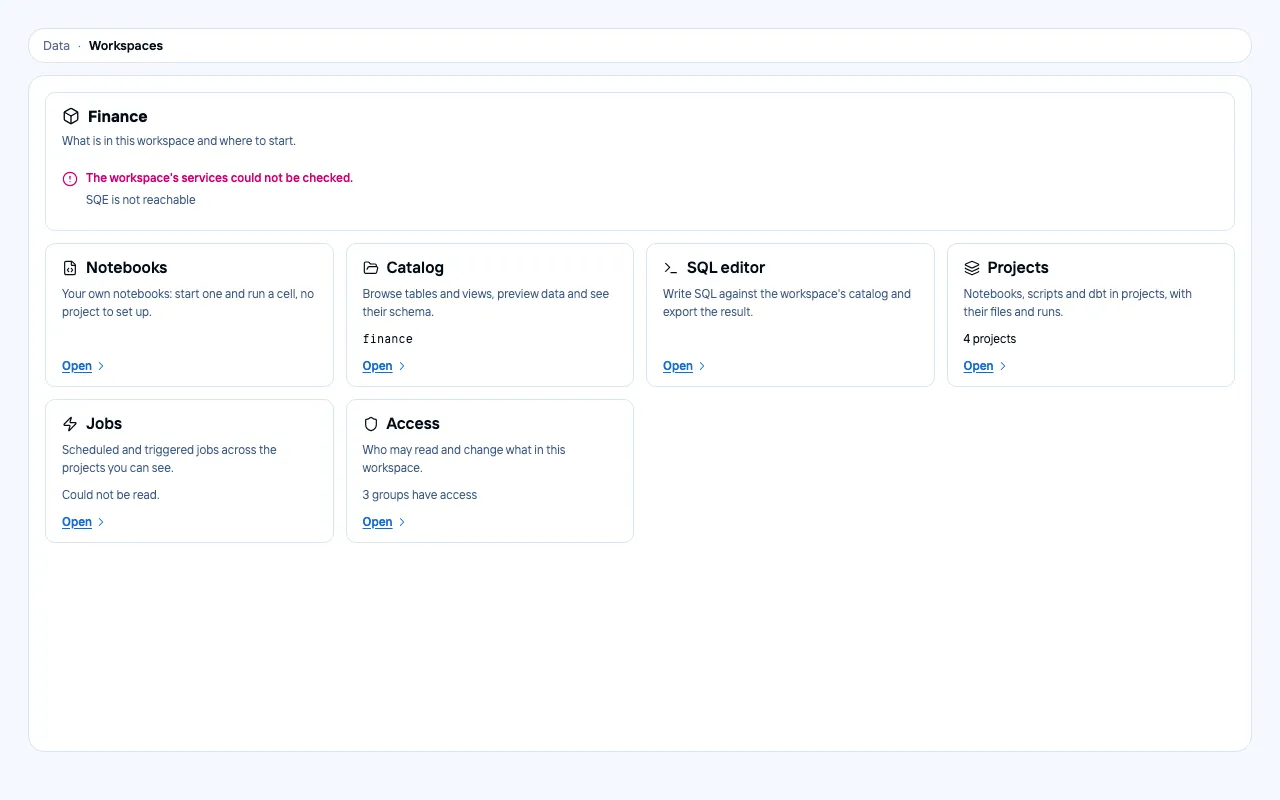 | 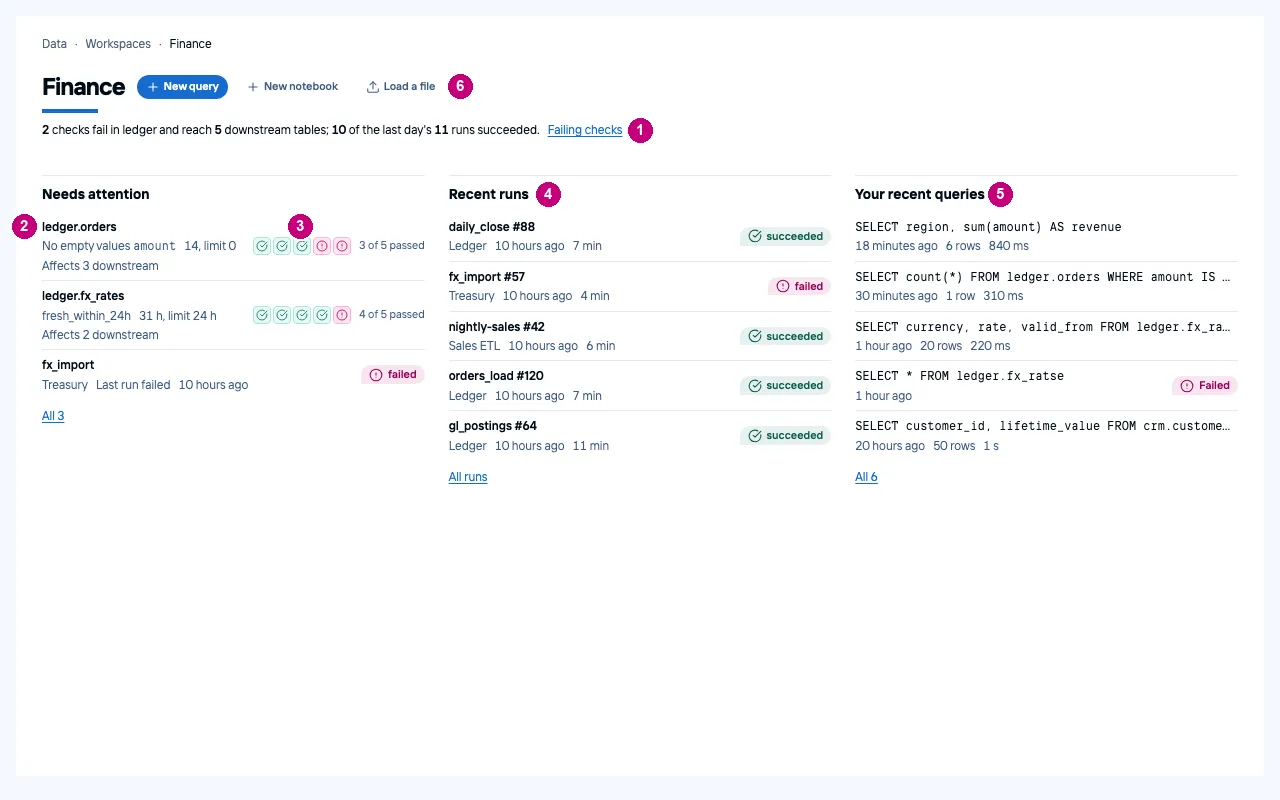 |
Workspaces
Before: a list of rows. After, a table to compare workspaces:
- a page title, the marker and a finding: “4 workspaces; 2 have failing checks”;
- the name with its namespace on its own mono line, and a row that expands;
- the counts in aligned, sortable columns with tabular figures;
- a quality column: a ratio bar (failing hatched, not run outlined) plus the counts in words, with the failing count as the only pill;
- the groups, viewers first and the admin group on its own line.
| Before | After | |
|---|---|---|
| Dark | 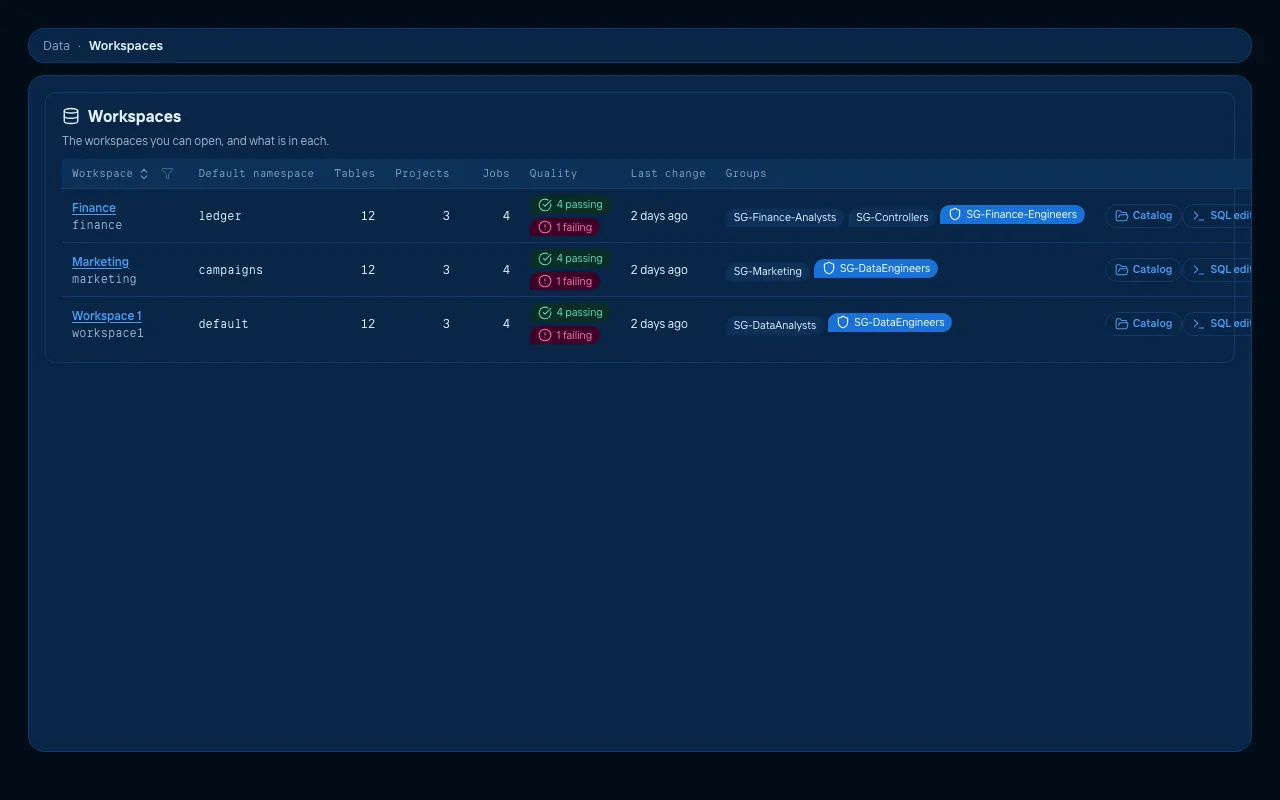 | 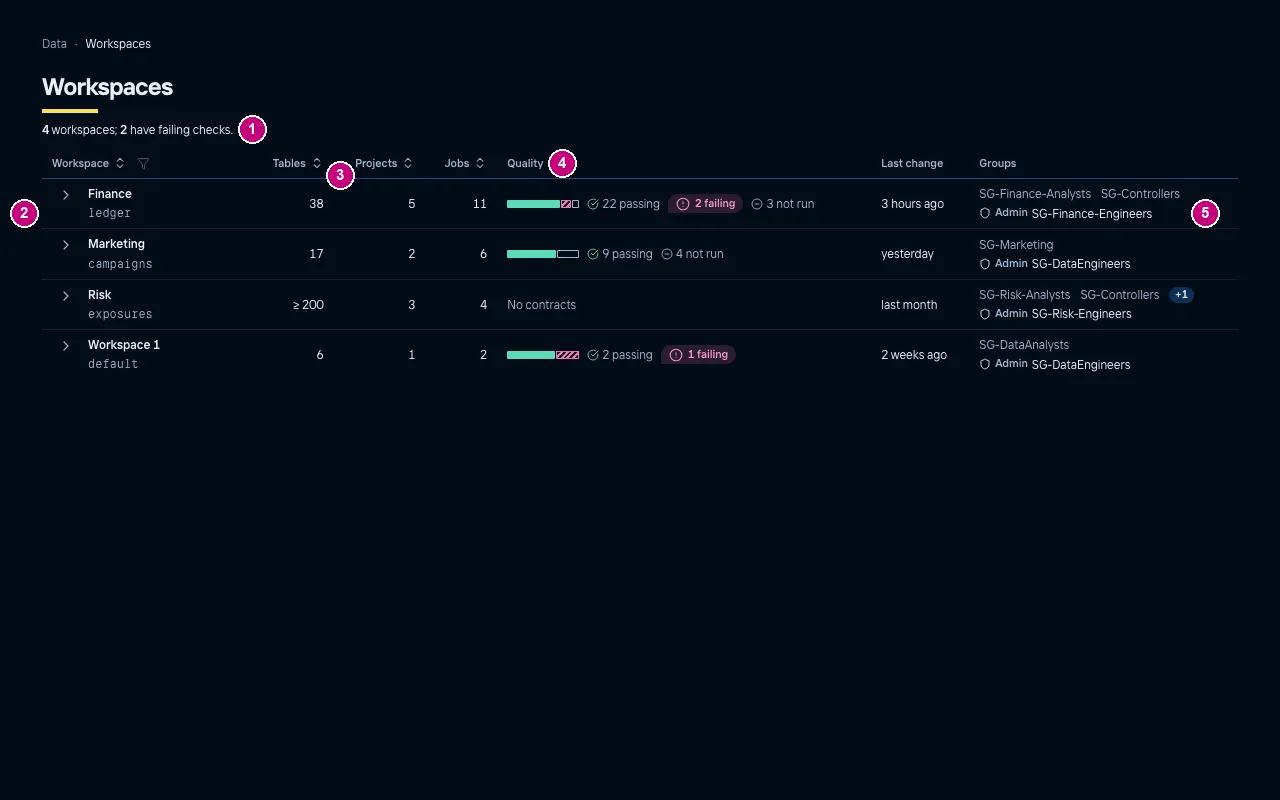 |
| Light | 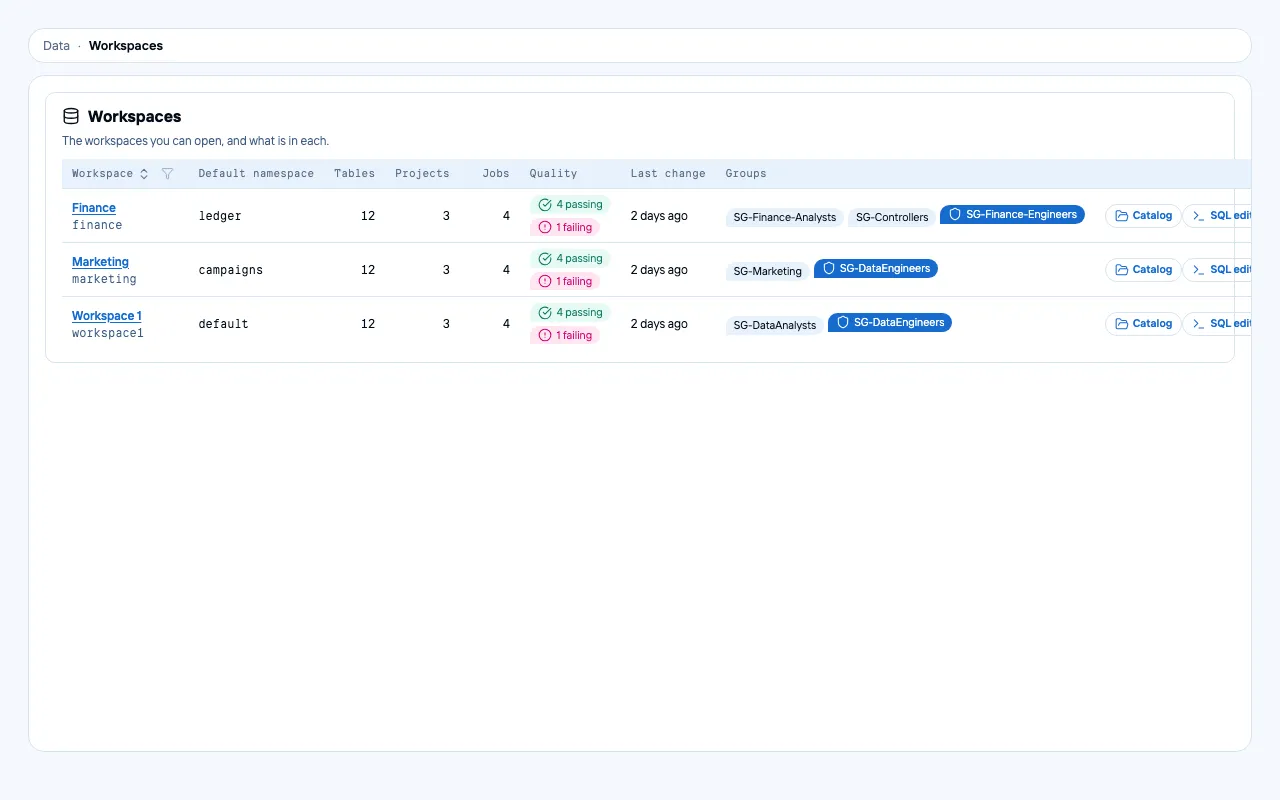 | 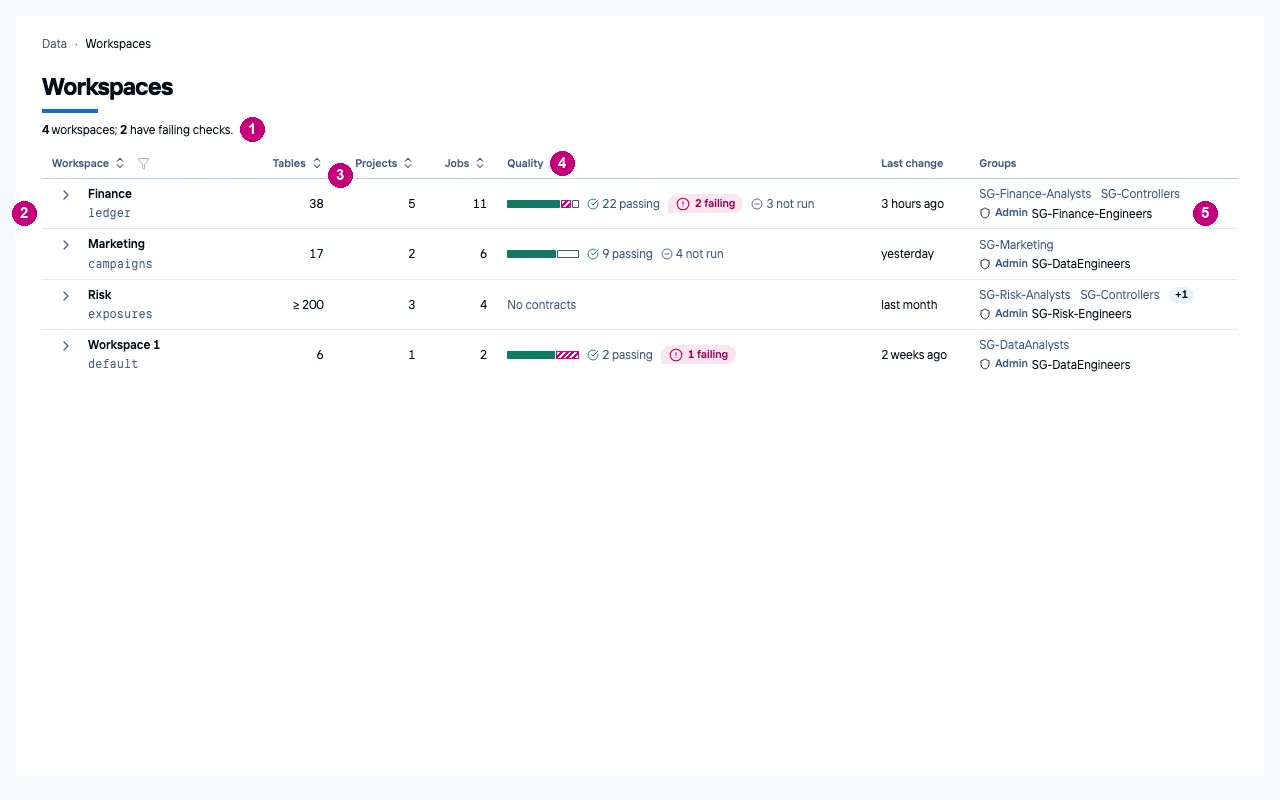 |
Catalog table
Before: the table name in mono body size, every column type in a pill, “Nullable” on every row, and a dashed chip for every classification. After:
- the table name as the page title with its level, and a finding: rows against a week ago, and which column holds personal data;
- an evidence band in three groups: rows with their trend and columns, last write and format, contract and profile;
- the tabs in three named groups: data, quality, access;
- the classification suggestion as one warning with its action (“Raise classification”);
- nulls as a small share bar beside the number; types as plain mono text, “Required” only where it applies;
- a classification chip only where a column differs from the table’s level, with an icon so colour is not the only signal.
| Before | After | |
|---|---|---|
| Dark | 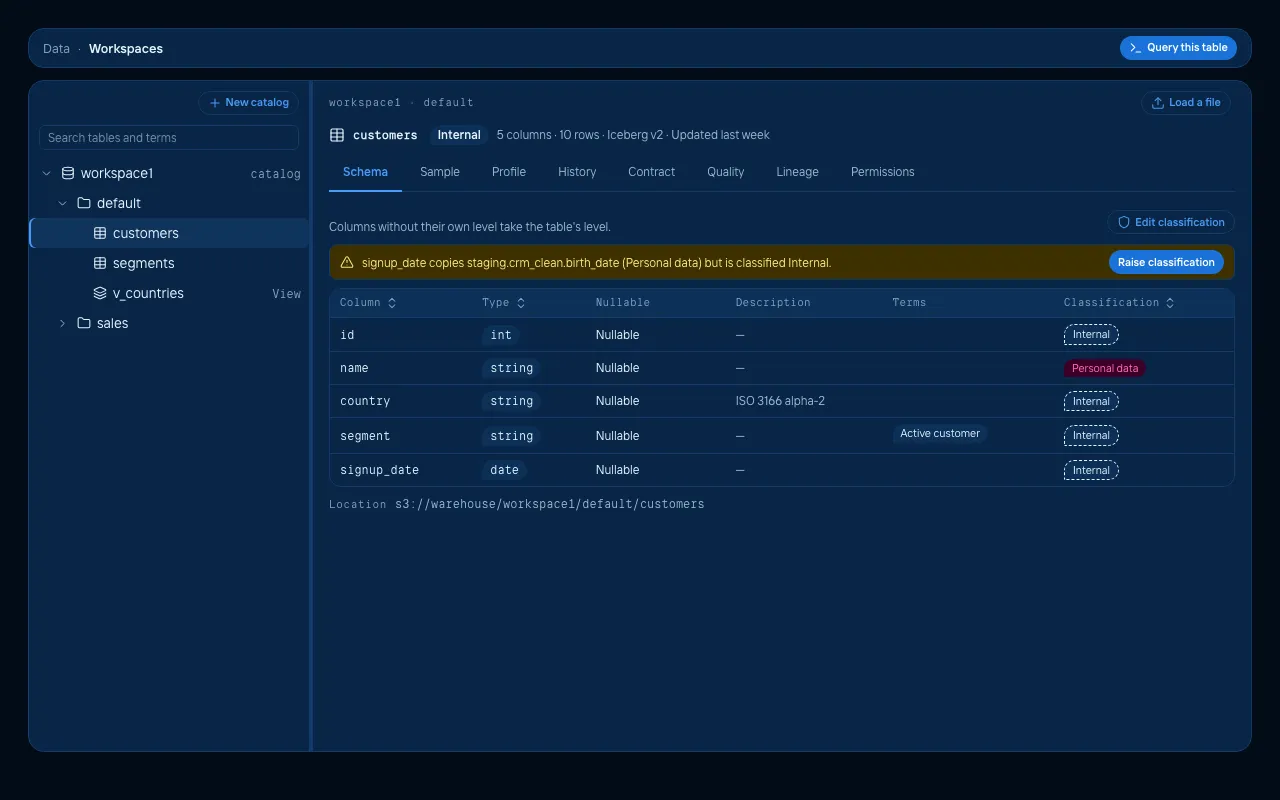 | 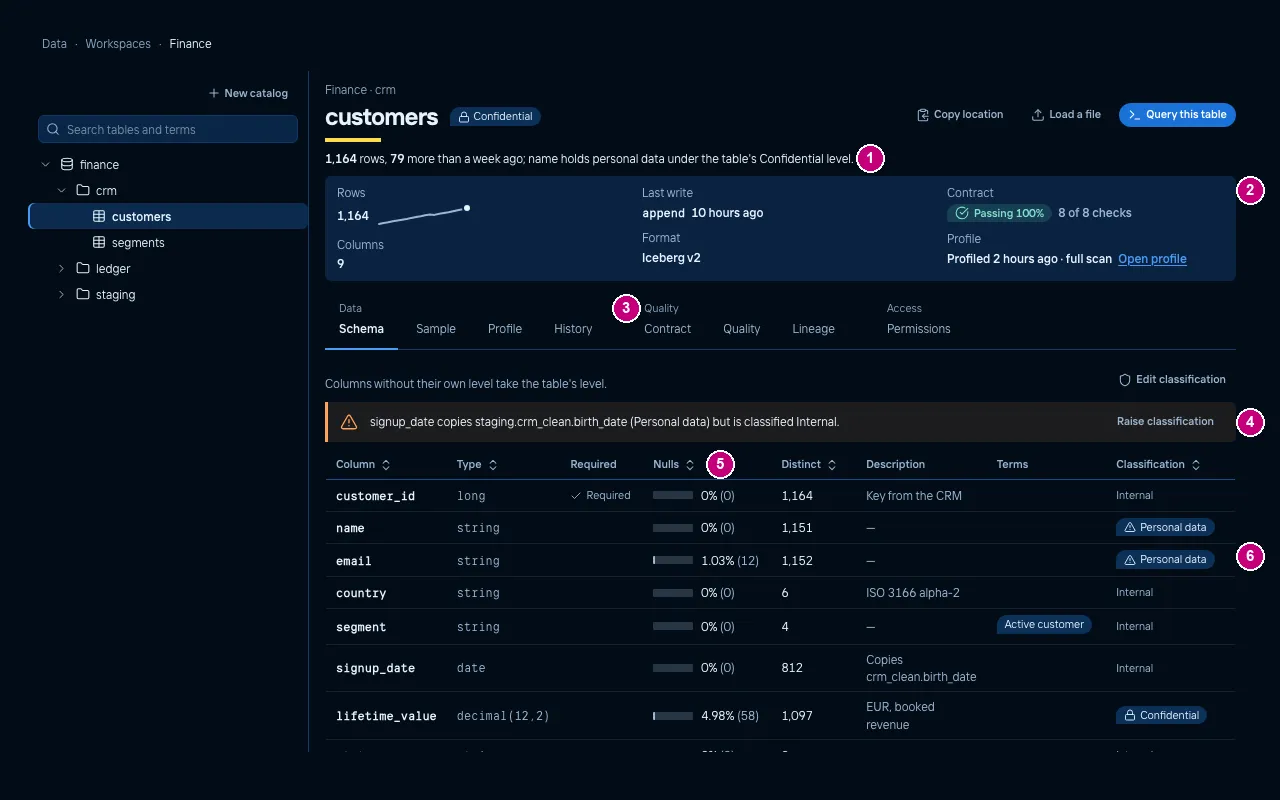 |
| Light | 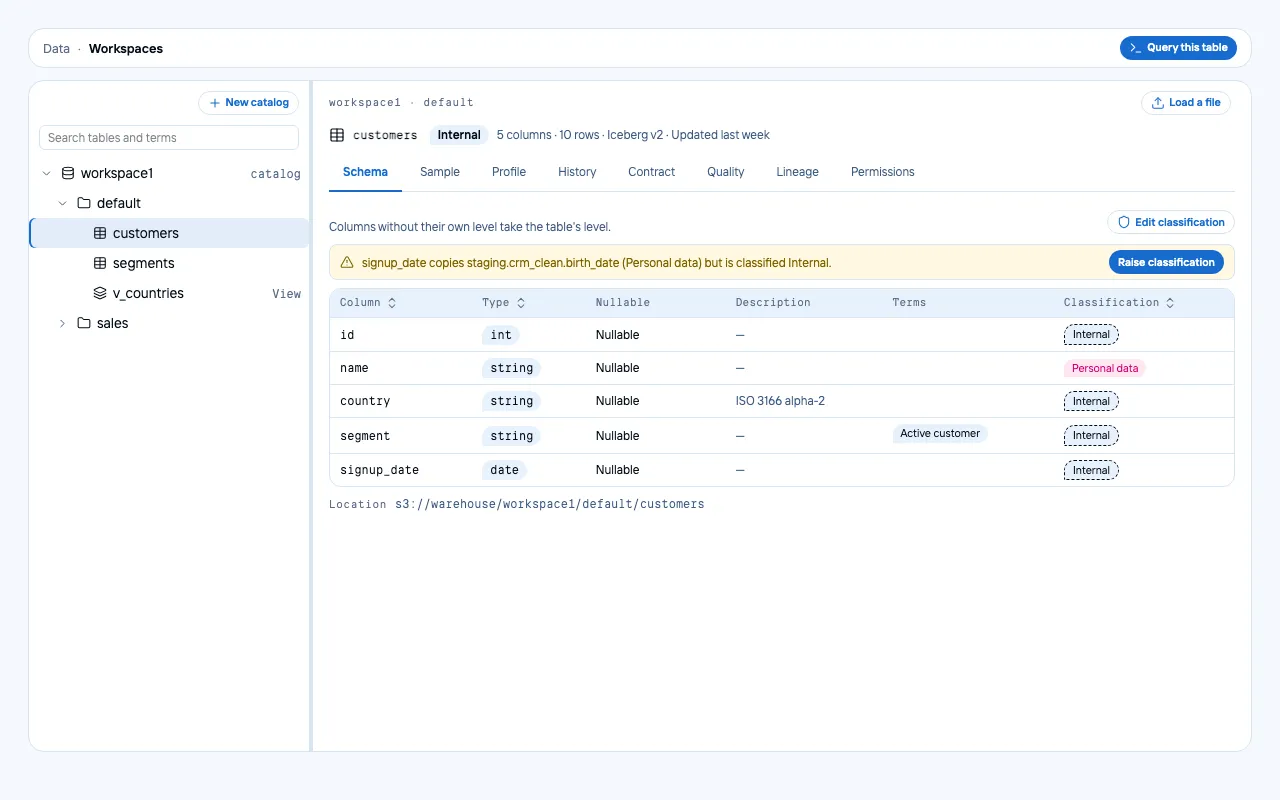 | 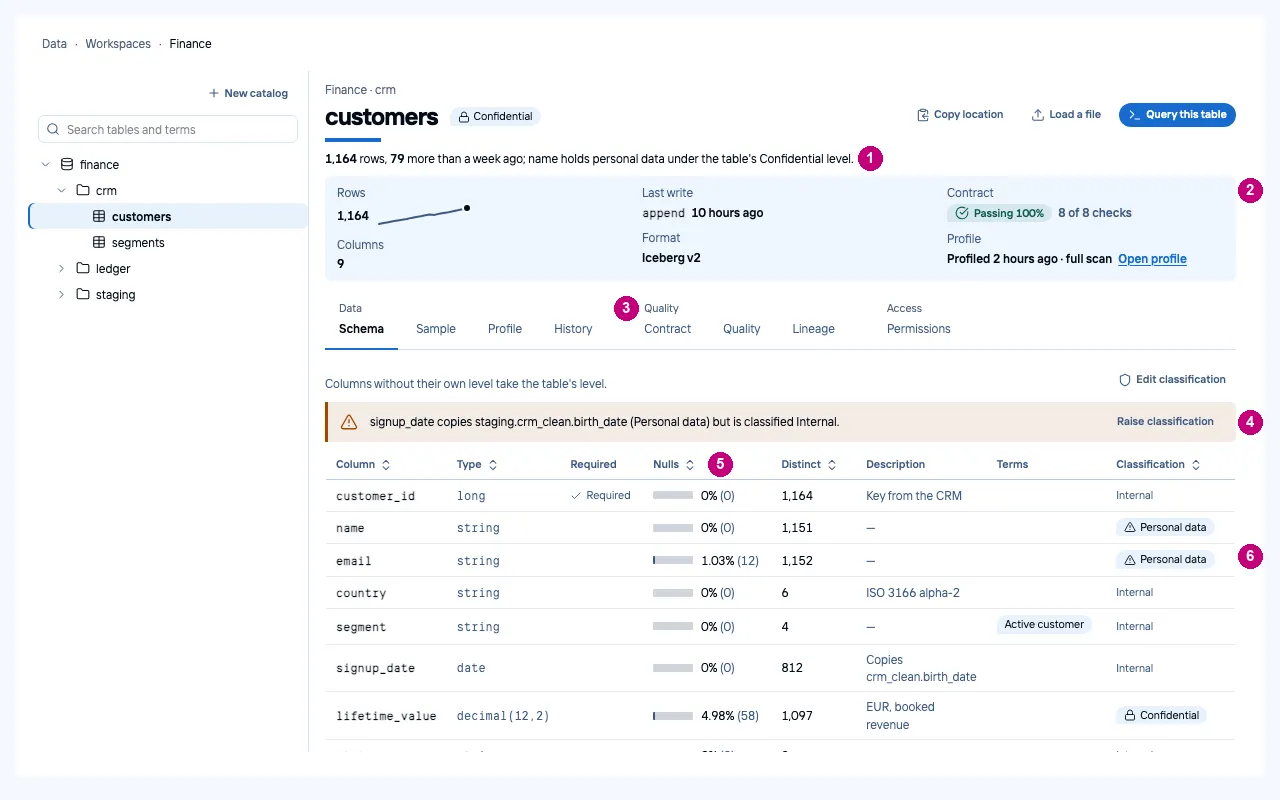 |
SQL editor
The screen that regressed in rounds 7 and 8 and was rebuilt in round 9. After:
- one tab per statement, the tab named after its SQL, and ”+” after the tabs;
- one toolbar: Run (the one filled button) and the row limit, Explain, the context (catalog and source dialect) with Translate in one group, then Save and the download;
- syntax colouring, and an editor only as tall as it needs;
- a result receipt: status, rows, duration, the engine and as whom it ran;
- a profile under each result column, computed in the browser from the rows returned: top values for text, a histogram with its range for numbers;
- a grid without a frame: a strong rule under the header, quiet rules between rows, tabular figures.
| Before | After | |
|---|---|---|
| Dark | 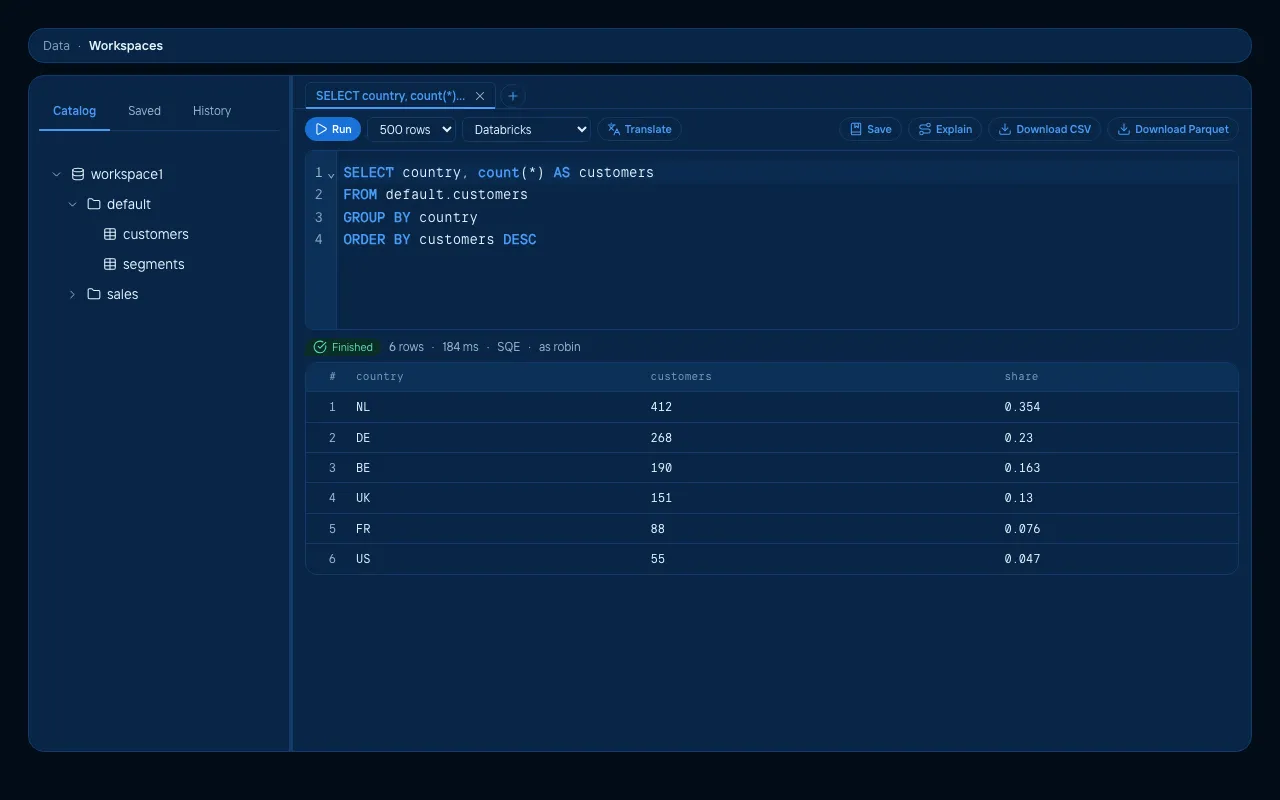 | 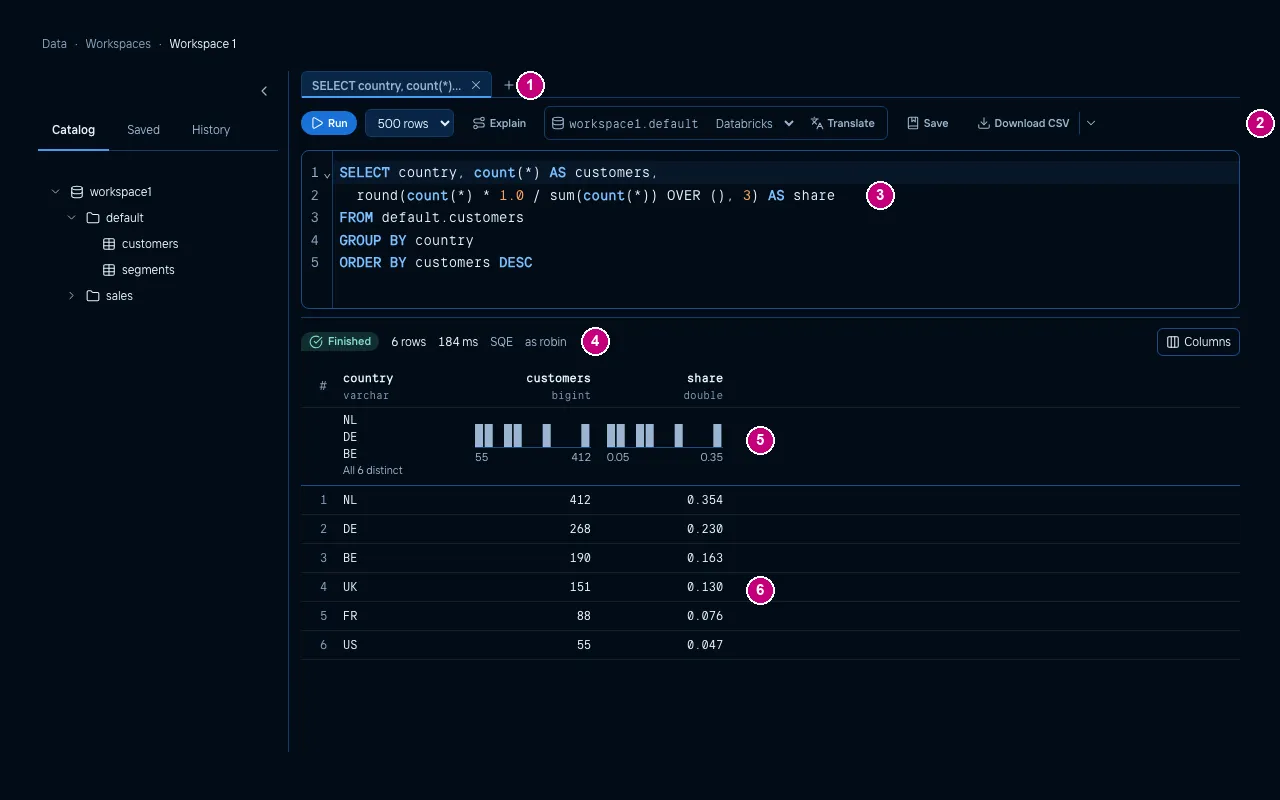 |
| Light | 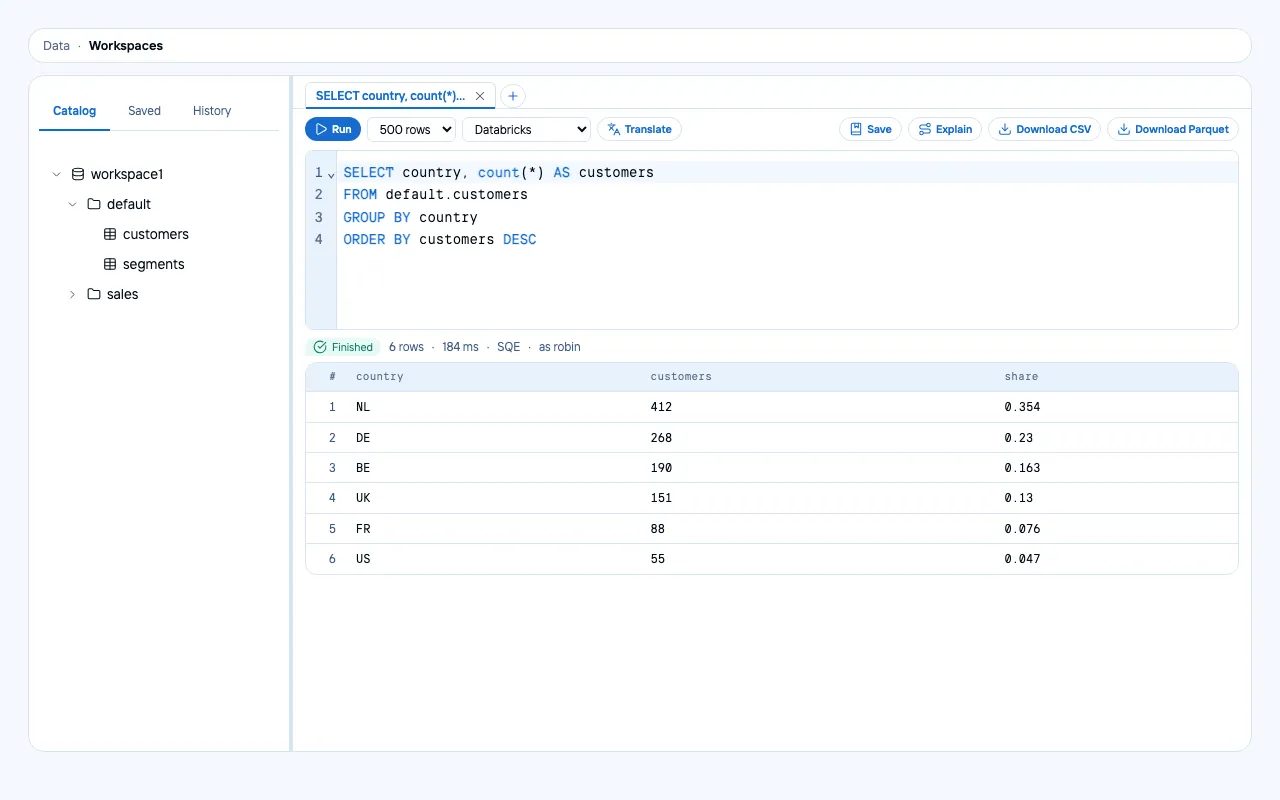 | 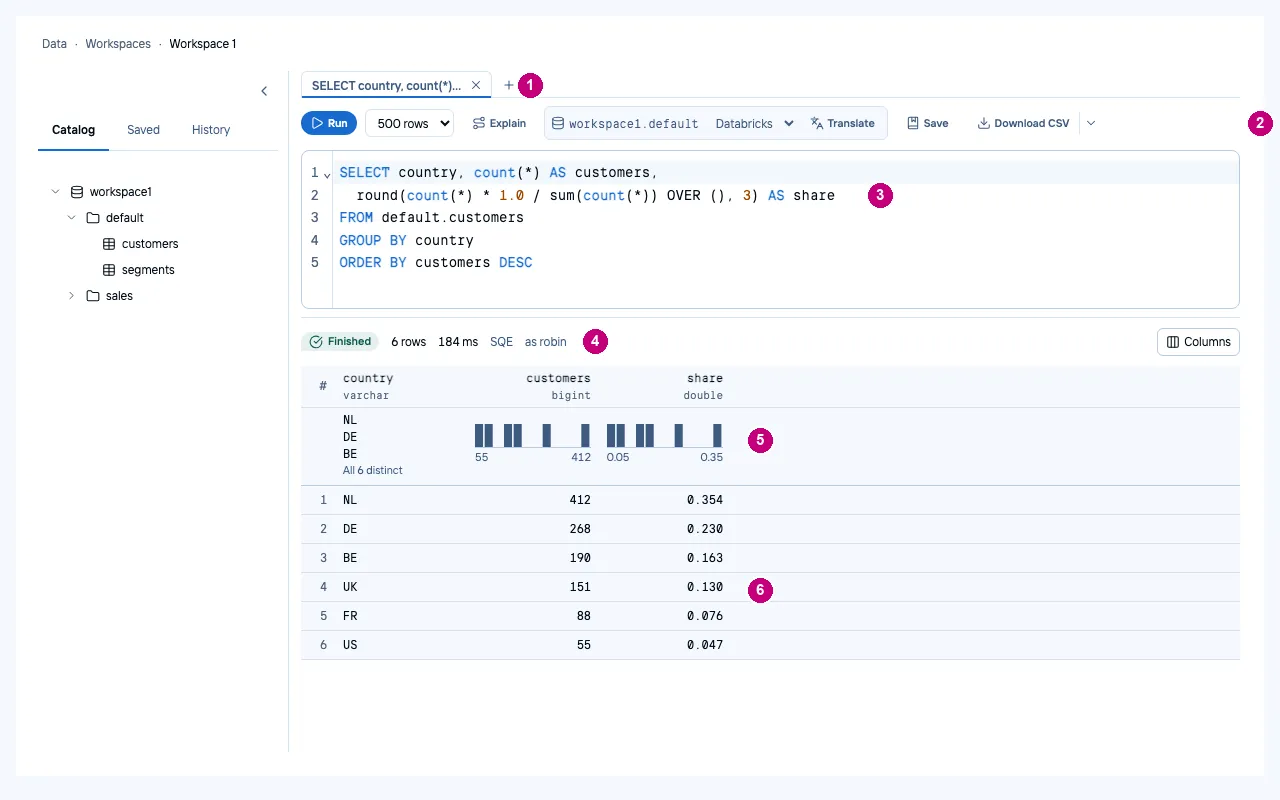 |
Job run
The graph itself was already there. Before, it sat inside a box inside a box, had green-filled nodes, and was preceded by a progress bar and a count pill that repeated the status. The labels were in upper case, and the attempts were loose rows. After:
- a page title with the run number and its status, and a finding against the 30-day median;
- the run facts in sentence case, including the time against the median;
- a run strip: the last runs as bars by duration, failures hatched, the median labelled, oldest and newest named, and a selector to step to the previous or next run;
- readable nodes with their status, duration, the file they run and their retry note, a coloured edge bar instead of a fill;
- zoom and fit on the graph, beside the Graph / Timeline switch;
- a details rail: who started it, as whom it ran, the project, the commit and the parameters;
- the attempts as an aligned table, with the log action in its row.
| Before | After | |
|---|---|---|
| Dark | 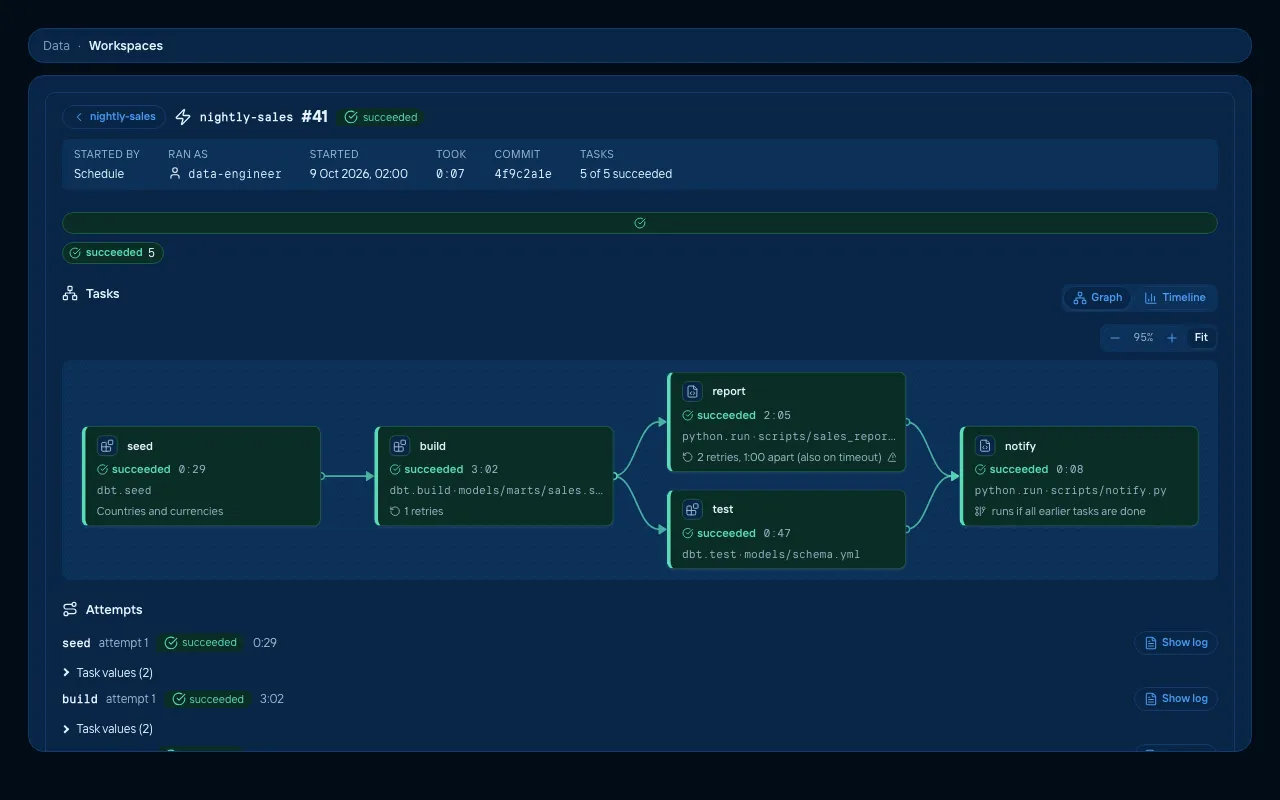 | 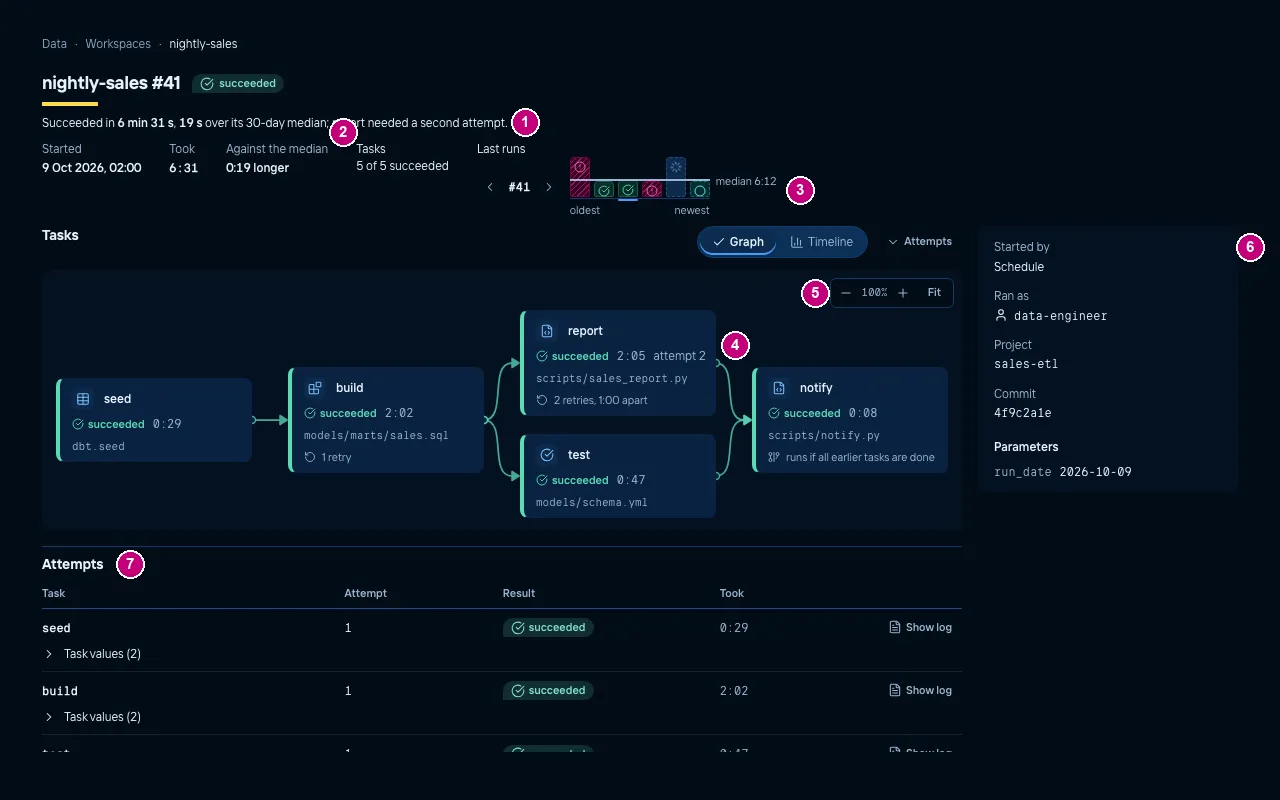 |
| Light | 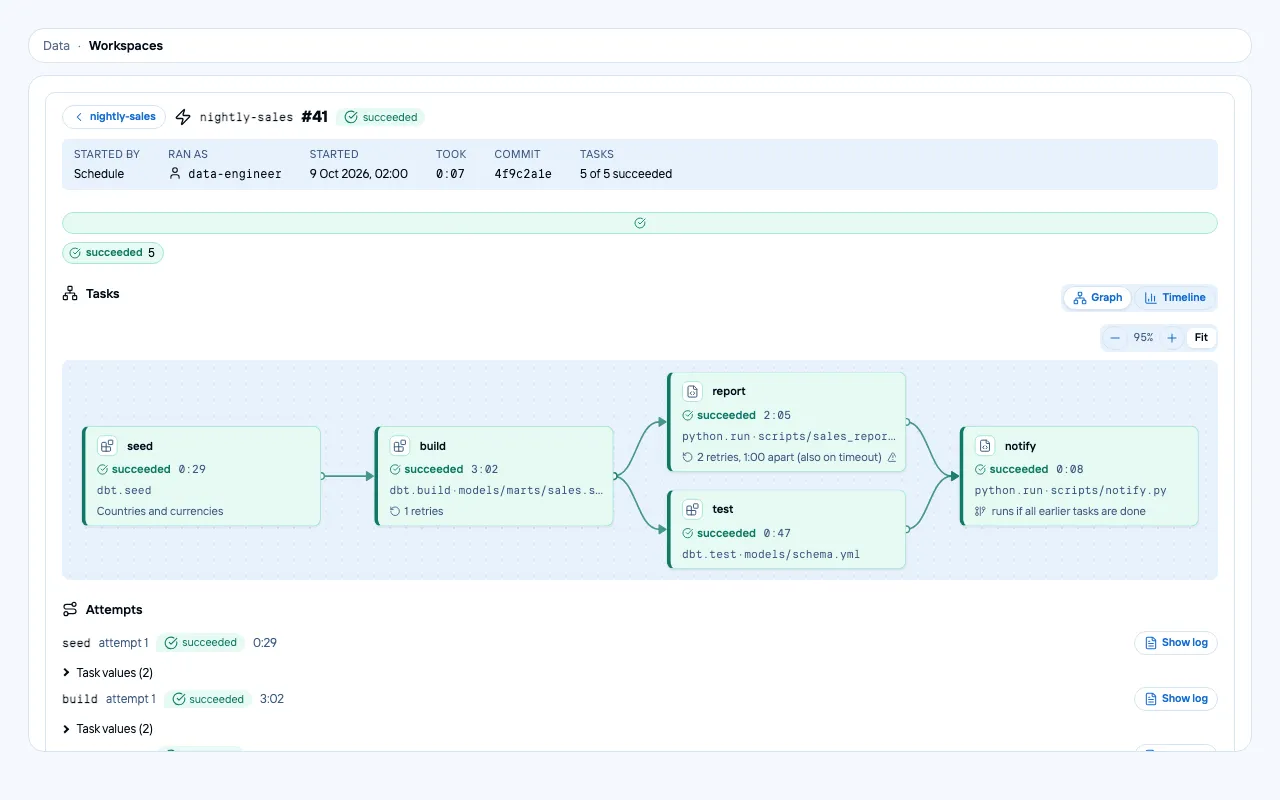 | 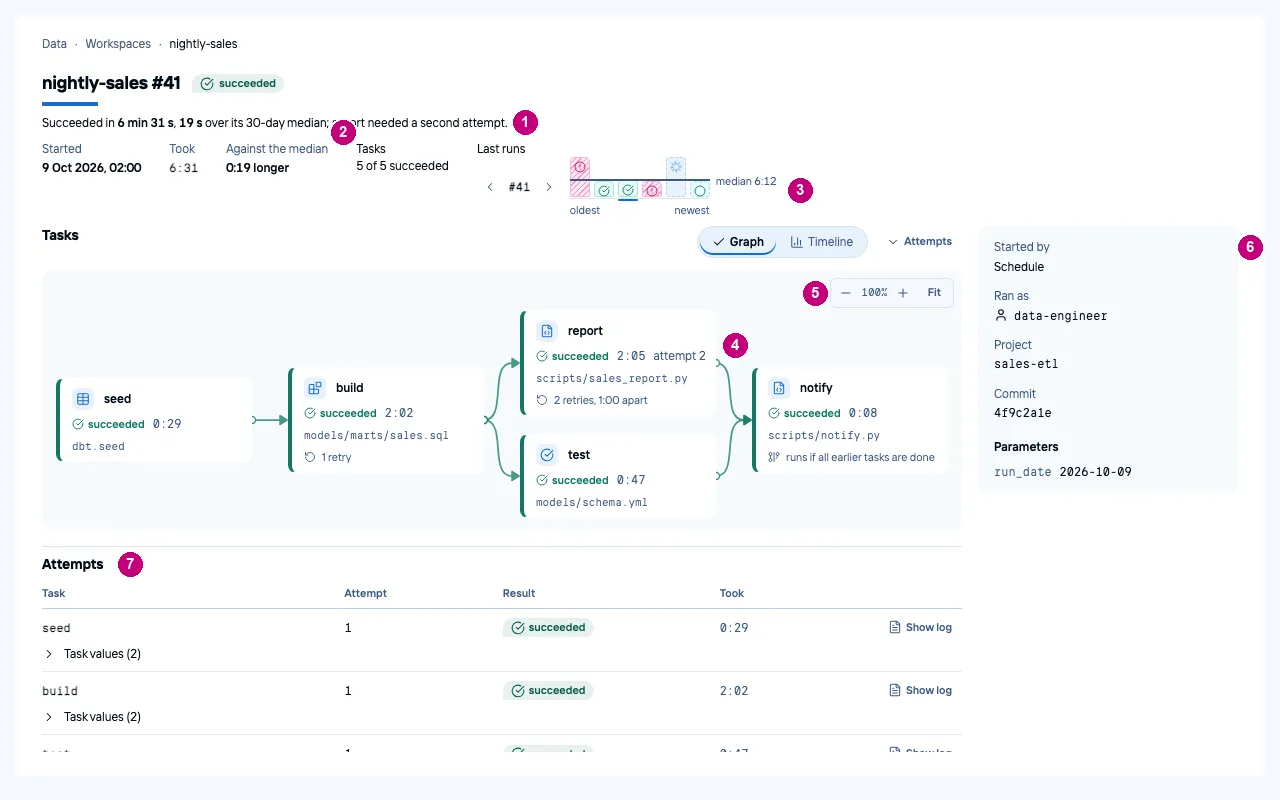 |
What it cost
Nine scored rounds (0 to 5 and 7 to 9) plus one ideas round, with three judges in each round where Codex had quota, spread over two days. The judges and the implementing agents all run on subscriptions we already pay for. Most of the agent time goes to building the fixes, not to judging them: the round-8 build, which took ideas from all three documents at once, ran for hours, and a scoring round takes about ten minutes.
We kept the usual rules of this repository:
- Every change lands as signed commits in normal pull requests (#439 to #442 merged, #445 open), reviewed and merged by the owner.
- Layout changes that alter what the spec promises went through an OpenSpec change first (data-ui-layout, #441).
- The rest is guarded by Storybook tests in dark, light and Dutch.
What is next
- Land #445 (tier B and rounds 8 and 9). Its open items: the portal end-to-end test, the component-style bundle
budget in
make ui-check(8 kB, now 17.23 kB), a decision on the notebooks page template, and the capitalisation of the status key. - The next fixes the judges agree on (round 9):
- the SQL profiles as three separate pictures, and the grid to the dock’s edge;
- the dark home’s columns as filled tiles;
- share and null bars that do not read as a value at 0%;
- “attempt 2” beside “2 retries” on the job run, which reads as a contradiction;
- distinct icons for Workspaces and Catalog, and for Access and Admin.
- Tier C (data-recents, #440): recents and favourites, so the home can show what you worked on, not only what failed.
Grok puts its presentation fixes at about +0.7 together. After rounds 7 and 8 we no longer add up lift estimates: even if they all held, the average would land near 8.2, level with Snowflake and still well short of 9. To beat both by a clear margin, the judges point at what the competitors cannot show: the finding line and the evidence behind it, on every screen. That is where we will spend the next rounds.
All rounds, briefs, ideas, results and screenshots are kept locally in .run/design-score/, which is not in git.